Gaurav Haresh Patil

Industrial Engineer (MIE) | Mechanical Engineer

Open to full-time IE / CI roles

About

I'm an industrial and mechanical engineer with an M.S. in Industrial Engineering from the University of Houston and a Lean Six Sigma Green Belt. I build lightweight analytical tools for the problems I care about on the plant floor: process stability, equipment effectiveness, line balance, defect prioritization and the economics of equipment decisions. The projects below are live, and the code is public.

Projects

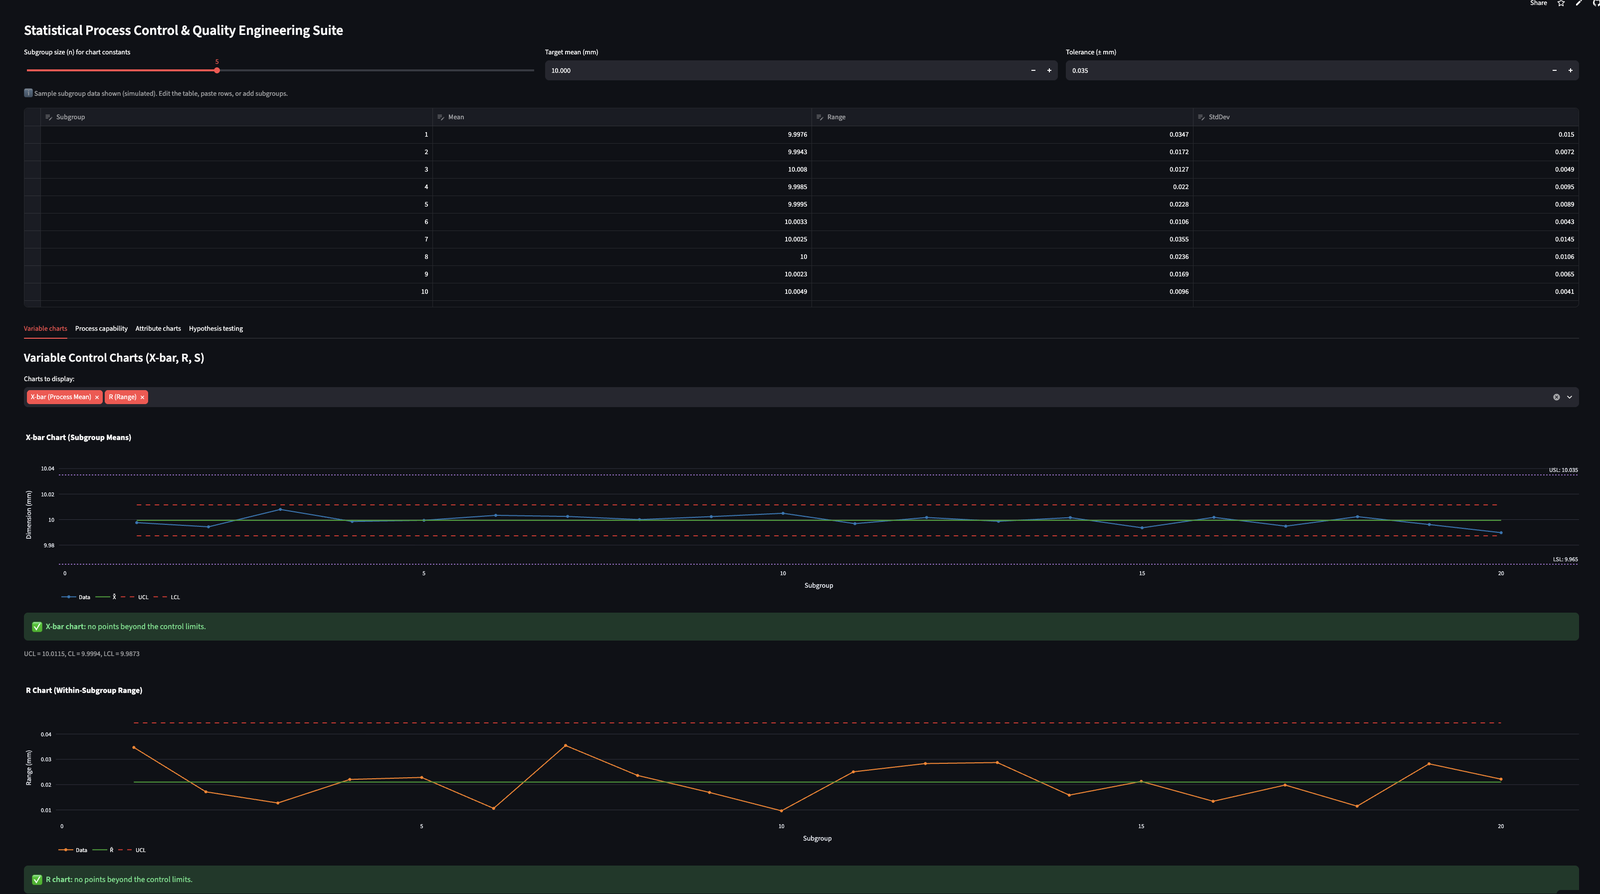
SPC control charts in the Manufacturing Operations Command Center

Manufacturing Operations Command Center

An interactive suite of the analyses plant and quality engineers run every day, plus a continuous-improvement toolkit for problem solving. Every table is editable, so the sample data can be replaced with real numbers.

  • SPC & process capability
  • OEE
  • Pareto analysis
  • MTBF / MTTR
  • Line balancing & takt
  • Six Sigma DMAIC
  • Gage R&R
  • FMEA
  • 5S
  • 5 Why & fishbone
  • 8D
  • Kaizen
  • Control charts (X-bar, R, S and attribute) with out-of-control points flagged, plus Cp, Cpk and Cpm.
  • Takt time, bottleneck and capacity-versus-demand checks for production lines.
  • Gage R&R study (ANOVA) with a simulator for gauge noise and operator differences, and an FMEA that flags Severity 9 or higher regardless of RPN.
  • 5S audit, 5 Why, fishbone, 8D tracker and Kaizen log, each with a chart. All sample data is simulated.
  • Calculations written as tested Python functions, separate from the interface.
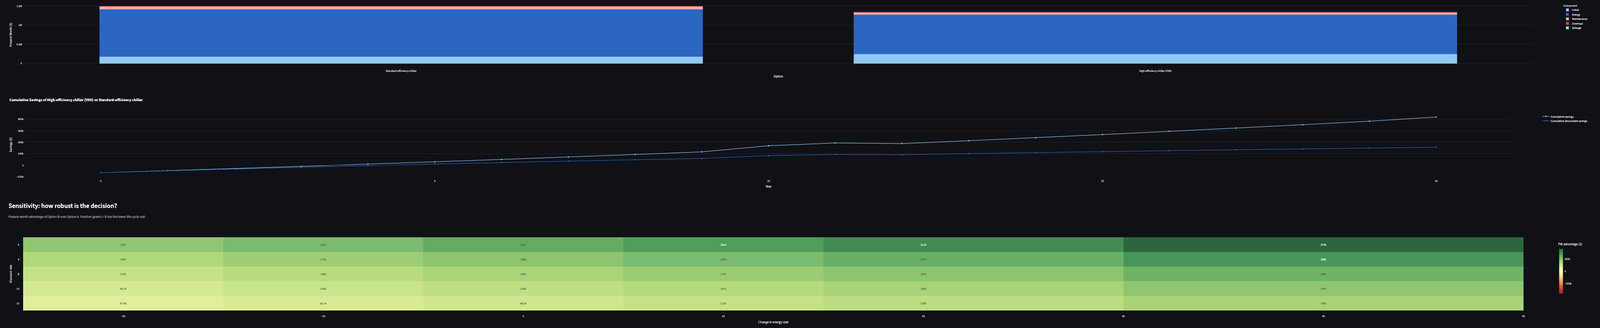
Sensitivity charts in the Engineering Economy and Facilities Decision Calculator

Engineering Economy & Facilities Decision Calculator

Decision tools for capital-equipment, energy and replacement questions. They put life-cycle costs on a common time-value-of-money basis instead of comparing first cost alone. Example inputs are illustrative placeholders, not real project results.

  • Life-cycle cost & EUAC
  • LED / VFD retrofit payback
  • Defender vs challenger replacement
  • Depreciation (SL, DDB, MACRS)
  • Project evaluation
  • Buy vs lease
  • Break-even purchase price, sensitivity charts and EUAC comparisons to support keep-or-replace and efficiency-upgrade decisions.
  • 48 unit tests check the formulas against textbook values and consistency properties.
  • Assumptions and limitations are documented in the README.
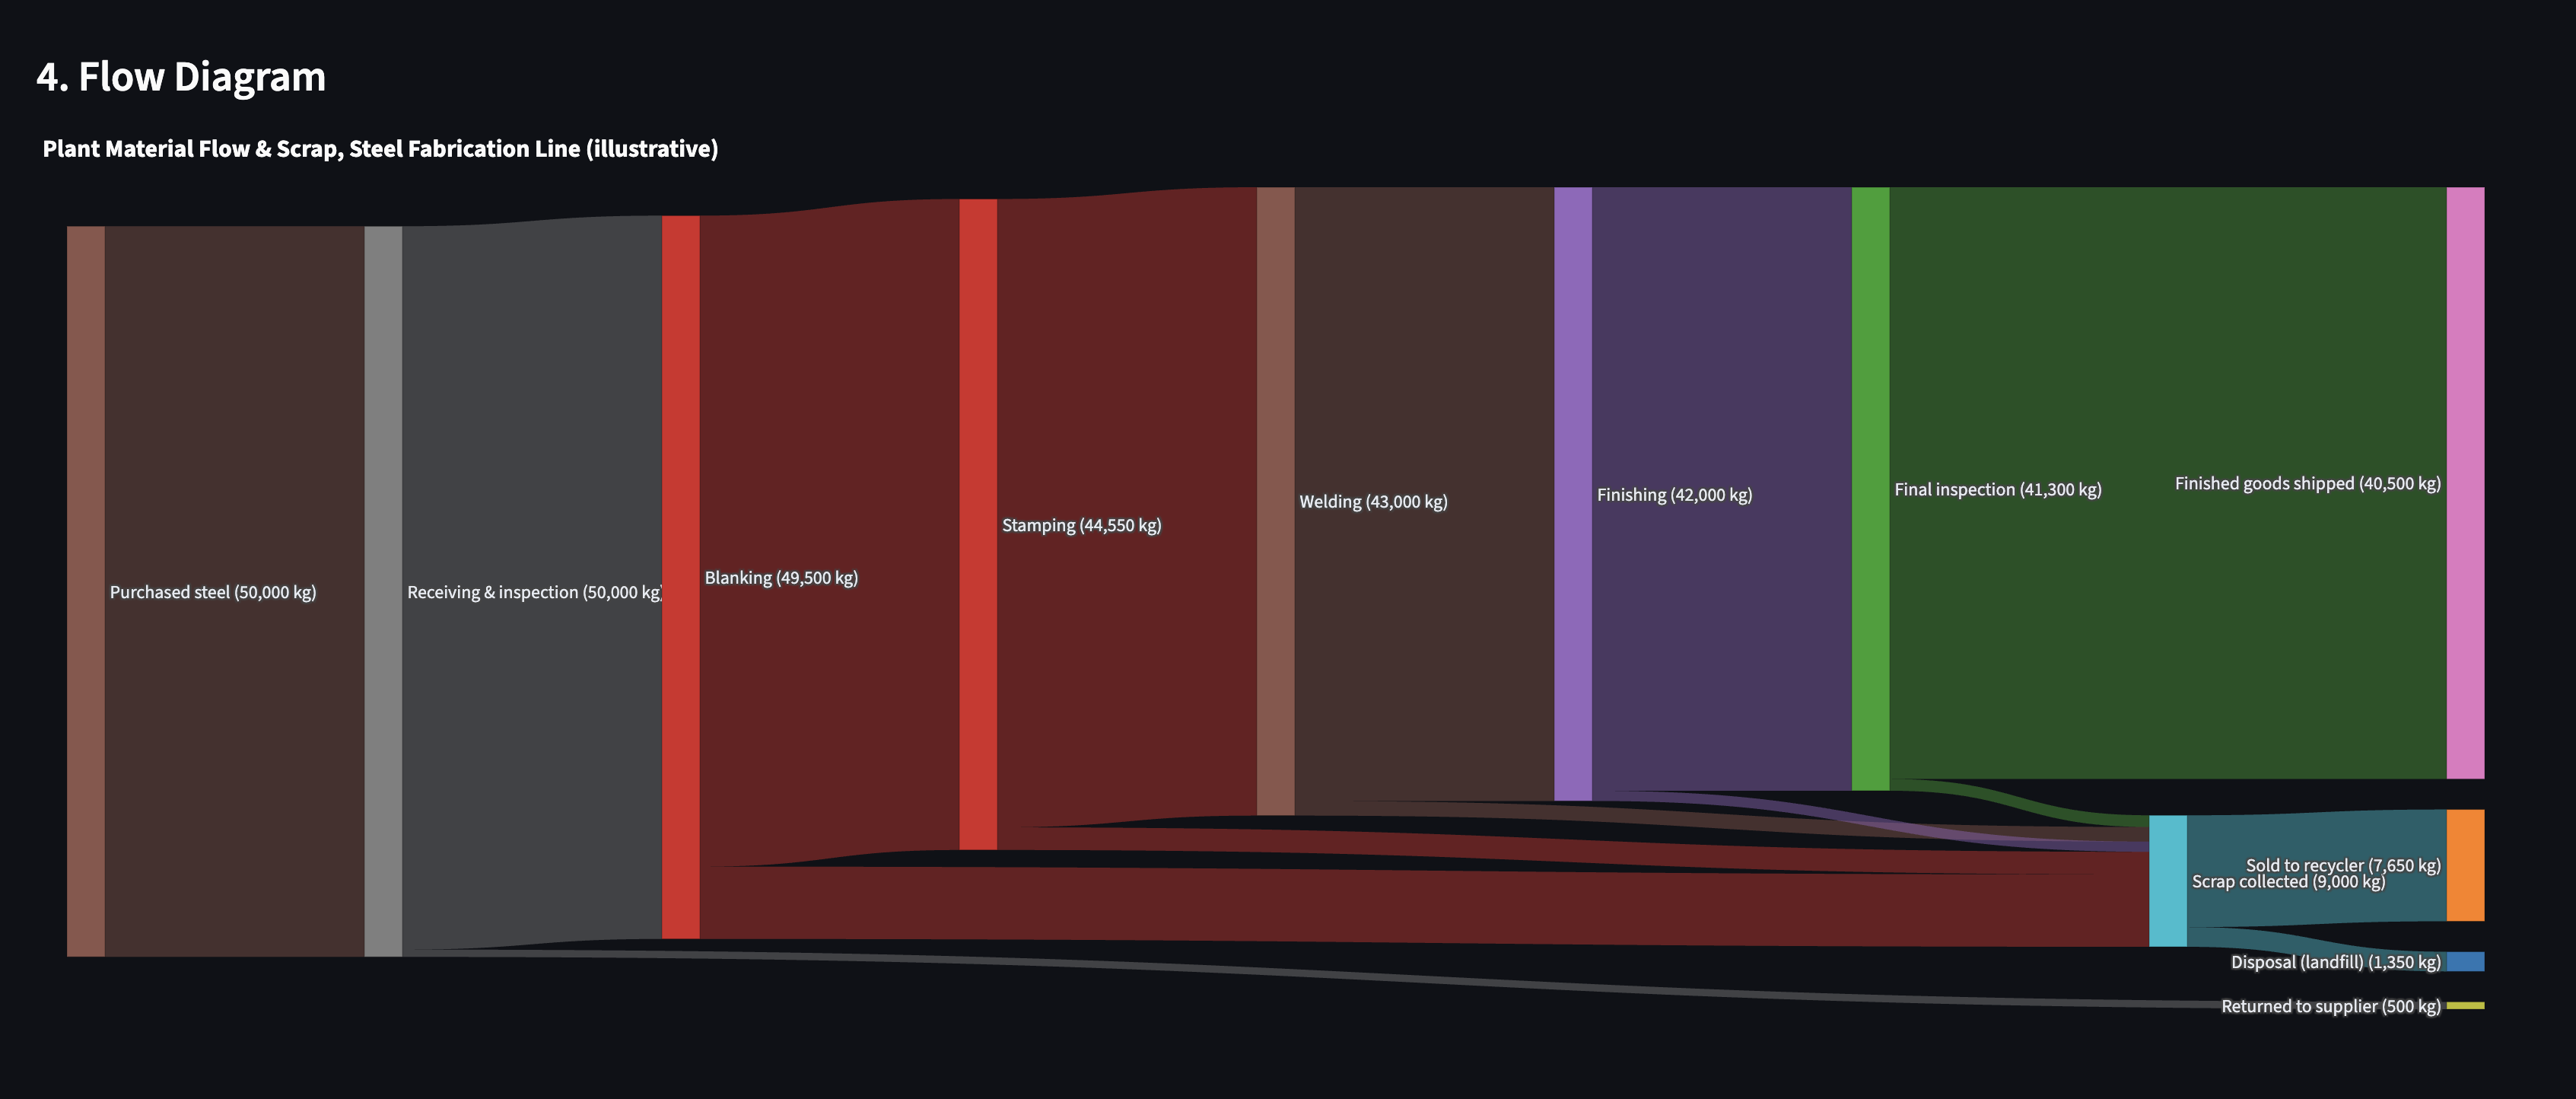
Plant material flow and scrap Sankey diagram with yield and scrap recovery tiles in the Flow Sankey Builder

Flow Sankey Builder

A tool that traces where material, energy, time, cost and parts go in a plant and checks that every stage balances. The seven engineering templates use made-up illustrative data, not real plant results; replace it with your own through the editable table or a CSV upload.

  • Yield & scrap
  • Energy balance
  • OEE losses
  • Quality / defects
  • Cost flow
  • Supply chain flow
  • Balance check flags any stage where what goes in does not equal what comes out, and names the size of the gap.
  • KPI tiles such as yield, scrap recovery, OEE and first-pass yield recalculate as the flows are edited.
  • 228 unit tests cover validation, balance checks, CSV parsing and the templates.
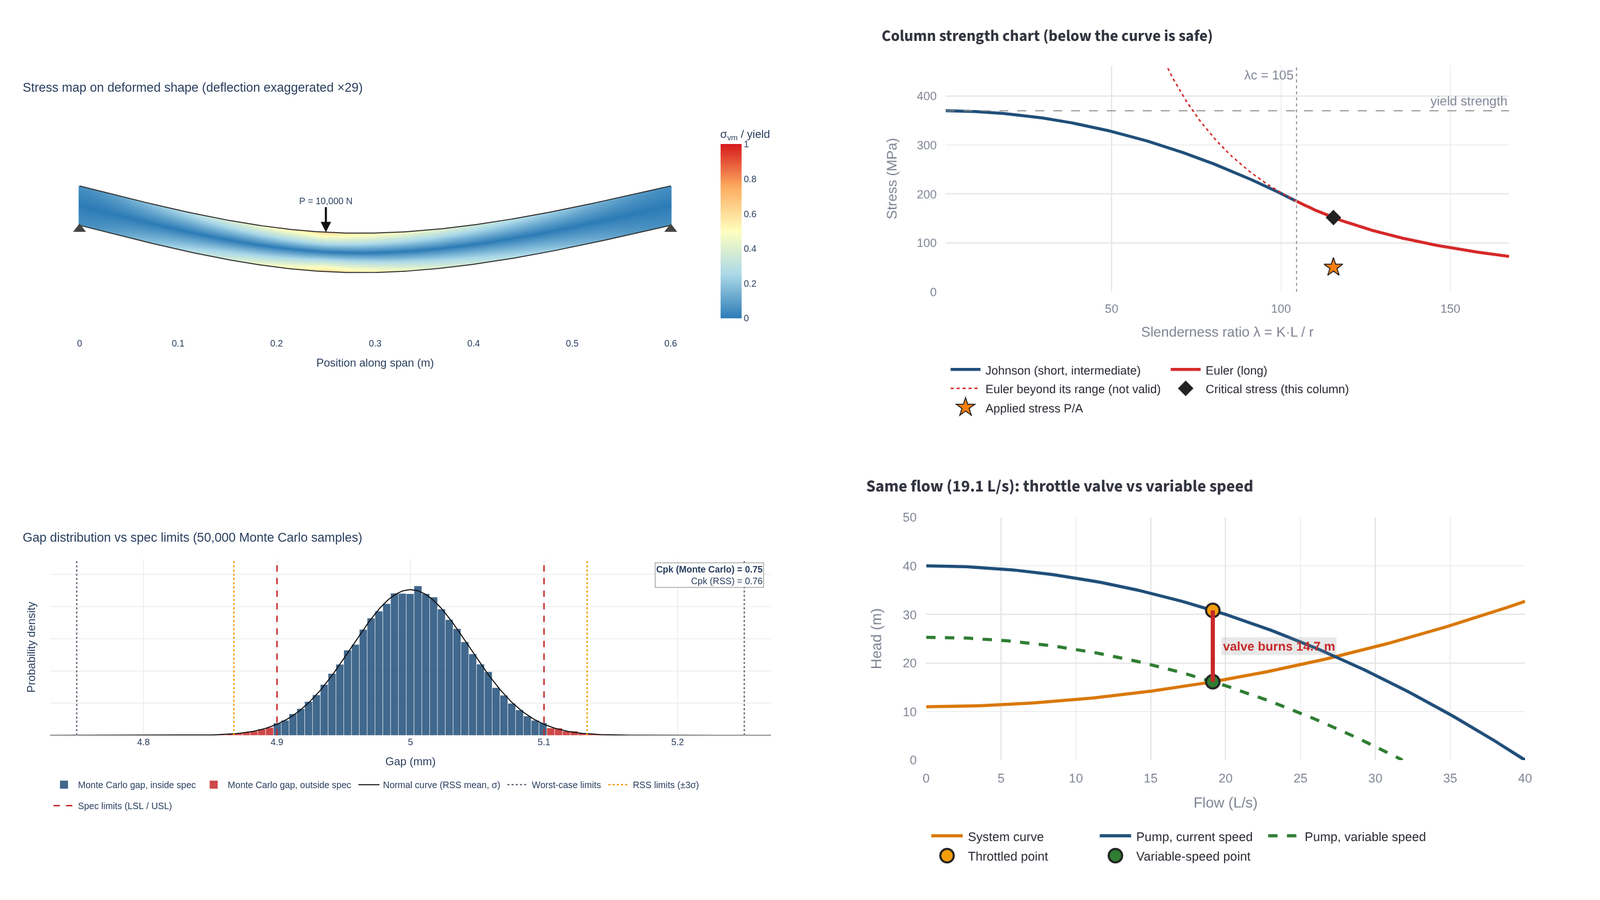
Beam stress map on the deformed shape, column strength chart with Euler and Johnson curves, tolerance stack-up gap histogram with Cpk, and pump head against system head for a throttle valve and a variable-speed drive in the Mechanical Design Explorer

Mechanical Design Explorer

Interactive tools for three questions mechanical and manufacturing engineers ask all the time: will this beam, shaft or column survive, will these parts assemble and which tolerance should be tightened, and where does a pump and pipe system lose pressure, cavitate or waste energy. Each chapter is a learning and screening tool, not certified design, and the example inputs are illustrative.

  • Beam, shaft & column stress
  • Safety factor & fatigue
  • Tolerance stack-up & Cpk
  • GD&T bonus tolerance (MMC / LMC)
  • Pump & pipe system
  • Cavitation (NPSH)
  • Pump energy & VFD savings
  • Thread, pipe & tolerance-grade tools
  • Stress map on the deformed shape for five support cases under point and uniform loads, shear and moment diagrams, safety factor, an optional Goodman fatigue check and Euler and Johnson column buckling, with a small 1D finite-element model cross-checked against closed-form beam equations.
  • Worst-case, RSS and Monte Carlo tolerance stacks with normal, uniform or triangular dimensions, Cp, Cpk, ppm, a tolerance budget solver and a ranking of the dimensions that drive the variation, plus GD&T position zones with bonus tolerance at MMC or LMC and a fastener formula (based on ASME Y14.5 concepts, not a certified interpretation).
  • Darcy-Weisbach pump and pipe analysis with the operating point, the bottleneck section, an NPSH cavitation check, parallel or series pumps, tank pressures and altitude, custom fluids, and pump power and yearly energy cost with a throttle valve vs variable-speed drive comparison (system-curve analysis, not CFD).
  • A basic-tools chapter adds ISO metric and UNC/UNF thread stress areas and clearance holes, steel pipe sizes, wall thickness under pressure (thin-wall and Lamé), plate stiffness against thickness and ISO 286 tolerance grades, with the same input checks.
  • Every calculation is checked against textbook formulas, hand calculations or published standard tables in 700 automated tests.
More projects are being added.

Ideas welcome

Have an idea for a feature, a dashboard that would be useful on the plant floor, or a whole new dashboard you would like to see? I would like to hear it. Message me on LinkedIn or email gauravgp26@gmail.com.